
Dashboard not Calculating
Hi Team,
Running into some dashboard issues.
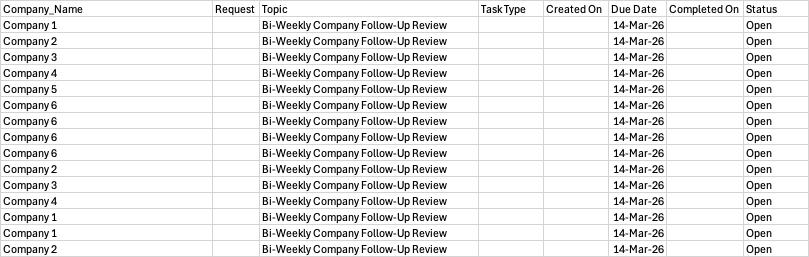
My goal is to show the companies in a bar chart with the amount of open tasks they have. Optionally , limit the output to the 10 companies with the most open tasks . Example table below.
| Company_Name | Request | Topic | Task Type | Created On | Due Date | Completed On | Status |
| Company 1 | Bi-Weekly Company Follow-Up Review | 14-Mar-26 | Open | ||||
| Company 2 | Bi-Weekly Company Follow-Up Review | 14-Mar-26 | Open | ||||
| Company 3 | Bi-Weekly Company Follow-Up Review | 14-Mar-26 | Open | ||||
| Company 4 | Bi-Weekly Company Follow-Up Review | 14-Mar-26 | Open | ||||
| Company 5 | Bi-Weekly Company Follow-Up Review | 14-Mar-26 | Open | ||||
| Company 6 | Bi-Weekly Company Follow-Up Review | 14-Mar-26 | Open | ||||
| Company 6 | Bi-Weekly Company Follow-Up Review | 14-Mar-26 | Open | ||||
| Company 6 | Bi-Weekly Company Follow-Up Review | 14-Mar-26 | Open | ||||
| Company 6 | Bi-Weekly Company Follow-Up Review | 14-Mar-26 | Open | ||||
| Company 2 | Bi-Weekly Company Follow-Up Review | 14-Mar-26 | Open | ||||
| Company 3 | Bi-Weekly Company Follow-Up Review | 14-Mar-26 | Open | ||||
| Company 4 | Bi-Weekly Company Follow-Up Review | 14-Mar-26 | Open | ||||
| Company 1 | Bi-Weekly Company Follow-Up Review | 14-Mar-26 | Open | ||||
| Company 1 | Bi-Weekly Company Follow-Up Review | 14-Mar-26 | Open | ||||
| Company 2 | Bi-Weekly Company Follow-Up Review | 14-Mar-26 | Open
|
The response I got from support is as follows:
Adding a formula field like:
count(select Tasks where Status = "Open")Using this result in a chart (bar chart)
This did not work. Since Status is a Choice field I also tried this:
count(select Tasks where text(Status) = "Open”)
Specific steps:
1. Create Page
2. Add Chart layout field to page (Select Bar, Data series is row)
3. In formula field, add the above query (both options).
So far no luck. "Error: Chart has no data. Please configure at least 1 number column in your view"
Validating table and field are valid:
select Tasks where text(Status) = "Open" lists all tasks as expected. Any help appreciated!
3 replies
-
Charts are not very intuitive. I am no expert at them, but I can tell you the basics.
The chart field is based on tables so the formula field in the chart has to be a selection of records.
Trying removing the count() command and you should see some results.
Now to customize the chart.
Open the chart and click on Edit Columns.
- Move over Company_Name and Status.
- Click on Company_Name can click on Grouped.
- Click on Status and click on Count.
- Click on OK
- Click on OK
Now you should see the chart with only one company name and the number of tasks.
Your next requirement is to find the top 10. I don't know of a way to do it if you use the Task table. Maybe someone else more knowledgeable knows.
If you created another table that is based on company that then has a single record that counts the number of open tasks. Then you can find the top 10 and create a chart on that.
Or another option is to use the charting features in post.
Content aside
- Status Answered
- 2 mths agoLast active
- 3Replies
- 32Views
-
2
Following