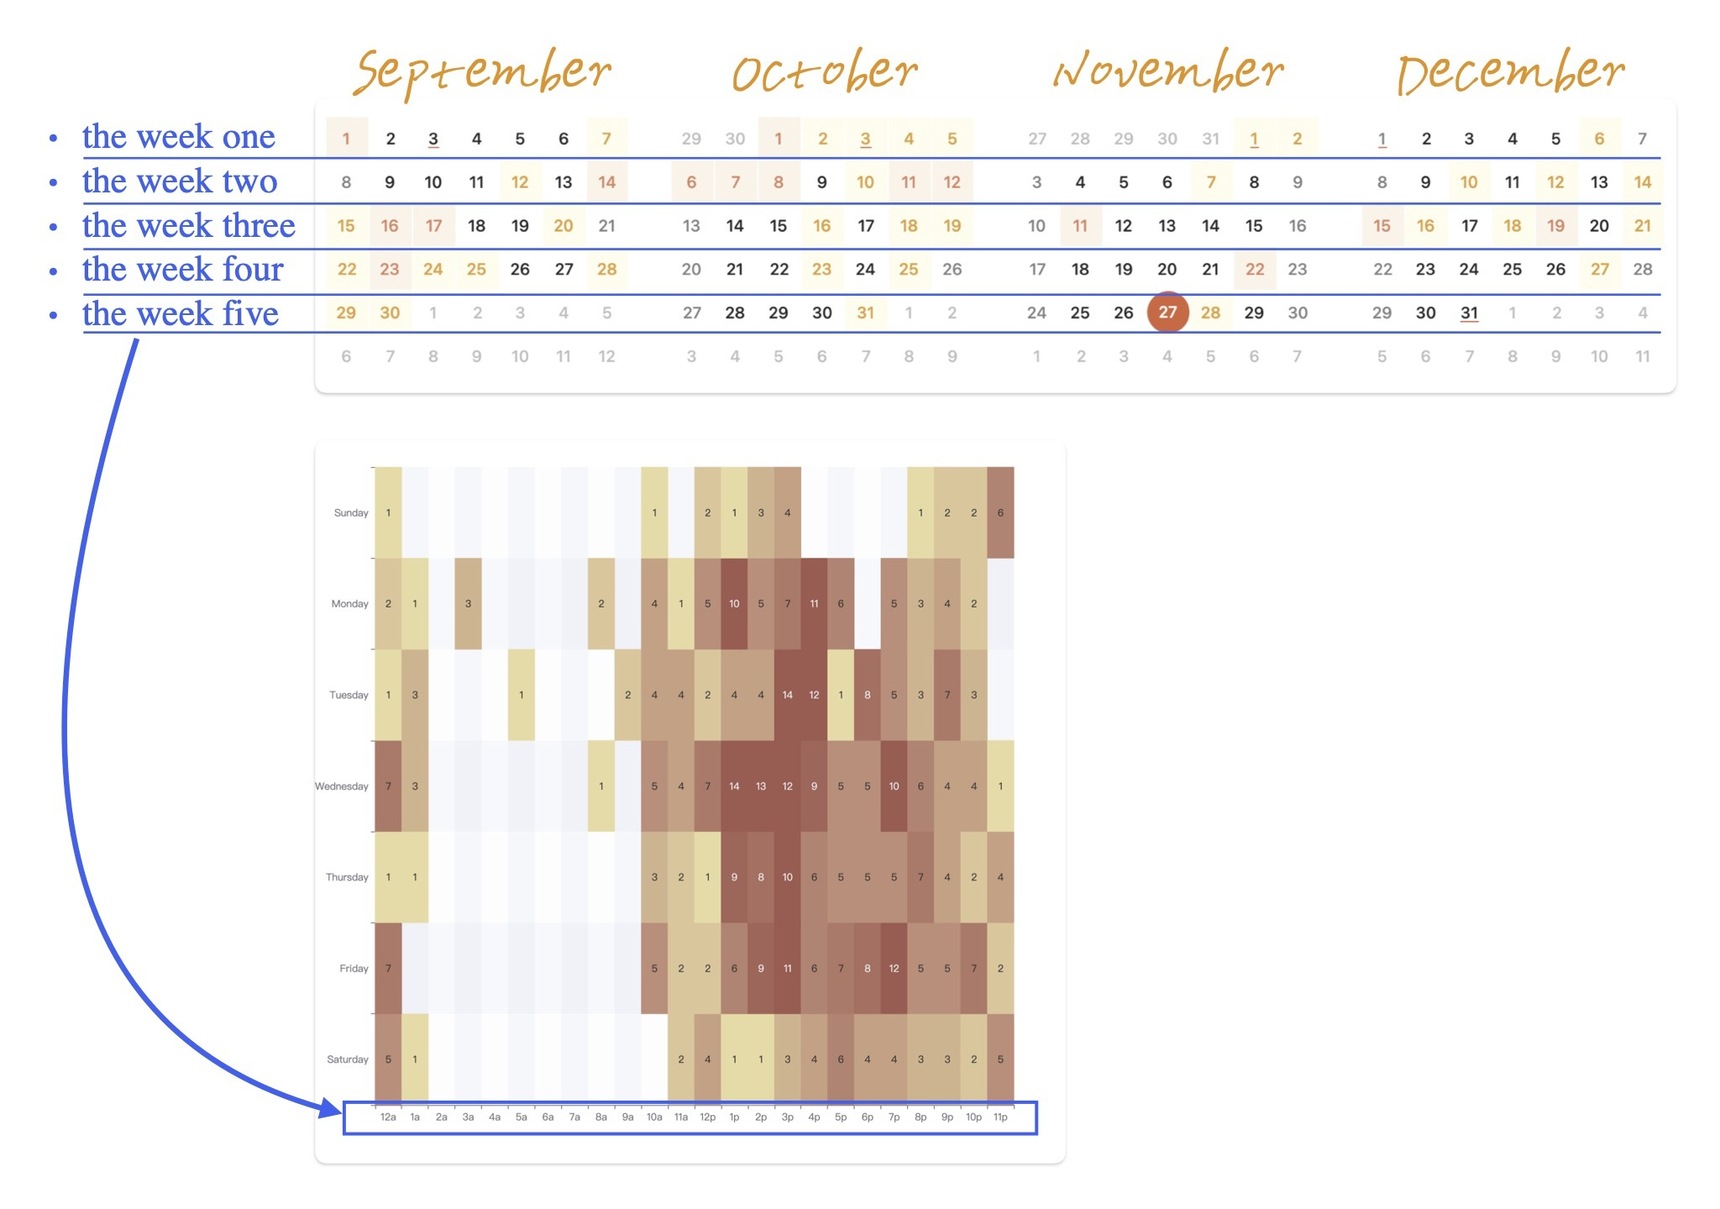
How can I calculate which week of the month a specific day falls into in Ninox?

How can I calculate which week of the month a specific day falls into in Ninox? There doesn’t seem to be a monthweek function. How can this be calculated?
I want to create a heatmap using this data. Does anyone have a better idea?
12 replies
-
Could you do something like:
switch true do case day(DateField) < 8: 1 case day(DateField) > 7 and day(DateField) < 15: 2 case day(DateField) > 14 and day(DateField) < 22: 3 case day(DateField) > 21: 4 end -
I don't know if I've translated and understood everything correctly. enclosed is a small DB with a suggestion for one year.
-
To calculate which week of the month a specific day falls into:
week(InputDate) - week(date(year(InputDate), month(InputDate), 1)) + 1 -
Thank you, , for the table, and thanks to and for the ideas. I found that ECharts has a built-in heatmap with a calendar, and it looks quite good.
I tried loading my database data into it, and it seems to have worked, so I’m sharing it with everyone. (It might contain some Chinese characters; you can try using ChatGPT to modify them—that’s what I did as well.)
let getData := ((select 'table')[year('time') = year(today())] order by 'time');
let firstday := weekday(date(year(today()), 1, 1)) + 1;
let olnyweek := unique(for entry in getData do
            format(entry.'time', "YYYY-MM-DD")
        end);
let newData := for riqi in olnyweek do
        let filteredData := getData[format('time', "YYYY-MM-DD") = riqi];
        let XSje := sum(filteredData.'number');
        {
            riqi: riqi,
            XSje: XSje
        }
    end;
let formattedData := for data in newData do
        [data.riqi, data.XSje]
    end;
let MaxData := for data in newData do
        data.XSje
    end;
html("
<head>
    <script src='echarts.min.js'></script>
    <style>
        html, body {
            margin: 0;
            padding: 0;
            width: 100%;
            height: 100%;
            overflow: hidden;
        }
        #main {
            width: 100%;
            height: 100%;
        }

        @media (max-width: 600px) {
            #container {
                width: 100%;
                height: 100%;
                overflow-x: auto;
                overflow-y: hidden;
                -webkit-overflow-scrolling: touch;
            }
            #main {
                width: 1200px;
                min-width: 1200px;
                height: 100%;
            }
        }
    </style>
</head>
<body>
    <div id='main'></div>
    <script>
        var myChart = echarts.init(document.getElementById('main'));

        var option = {
            tooltip: {
                formatter: function(params) {
                    var date = new Date(params.value[0]);
                    var amount = params.value[1];
                    var formattedAmount = amount.toString().replace(/\B(?=(\d{3})+(?!\d))/g, ',');
                    return date.getFullYear() + '年' + (date.getMonth() + 1) + '月' + date.getDate() + '日<br>' + formattedAmount + ' 元';
                }
            },
            visualMap: {
                show: true,
                min: 0,
                max: " +
max(MaxData) +
",
                type: 'continuous',
                orient: 'vertical',
                right: '1%',
                top: 'center',
                text: ['高', '低']
            },
            calendar: {
                top: '20%',
                left: '4%',
                right: '6%',
                cellSize: ['auto', 25],
                range: new Date().getFullYear(),
                itemStyle: { borderWidth: 0.5 },
                splitLine: {
                    show: true,
                    lineStyle: { width: " +
firstday +
", color: '#474647', type: 'solid' }
                },
                yearLabel: { show: false },
                dayLabel: { firstDay: 1, nameMap: ['日', '一', '二', '三', '四', '五', '六'] },
                monthLabel: {
                    nameMap: ['1月', '2月', '3月', '4月', '5月', '6月', '7月', '8月', '9月', '10月', '11月', '12月']
                }
            },
            series: {
                type: 'heatmap',
                coordinateSystem: 'calendar',
                data: " +
text(formattedData) +
"
            }
        };

        myChart.setOption(option);

        window.addEventListener('resize', function() {
            myChart.resize();
        });
    </script>
</body>
")
Content aside
- Status Answered
- 1 yr agoLast active
- 12Replies
- 130Views
-
4
Following


