0

How can I calculate which week of the month a specific day falls into in Ninox?

How can I calculate which week of the month a specific day falls into in Ninox? There doesn’t seem to be a monthweek function. How can this be calculated?

I want to create a heatmap using this data. Does anyone have a better idea?

12 replies

null
    • Fred
    • 2 mths ago
    • Reported - view

    Could you do something like:

    switch true do
    case day(DateField) < 8:
        1
    case day(DateField) > 7 and day(DateField) < 15:
        2
    case day(DateField) > 14 and day(DateField) < 22:
        3
    case day(DateField) > 21:
        4
    end
    
      • gold_cat
      • 2 mths ago
      • Reported - view


      Hi Fred, there are many variables in the actual situation. I’m considering whether this method is feasible.

      Would it be more accurate to set the time unit as 24 hours?

      • Fred
      • 2 mths ago
      • Reported - view

      Can you expand on your thinking?

      • gold_cat
      • 2 mths ago
      • Reported - view

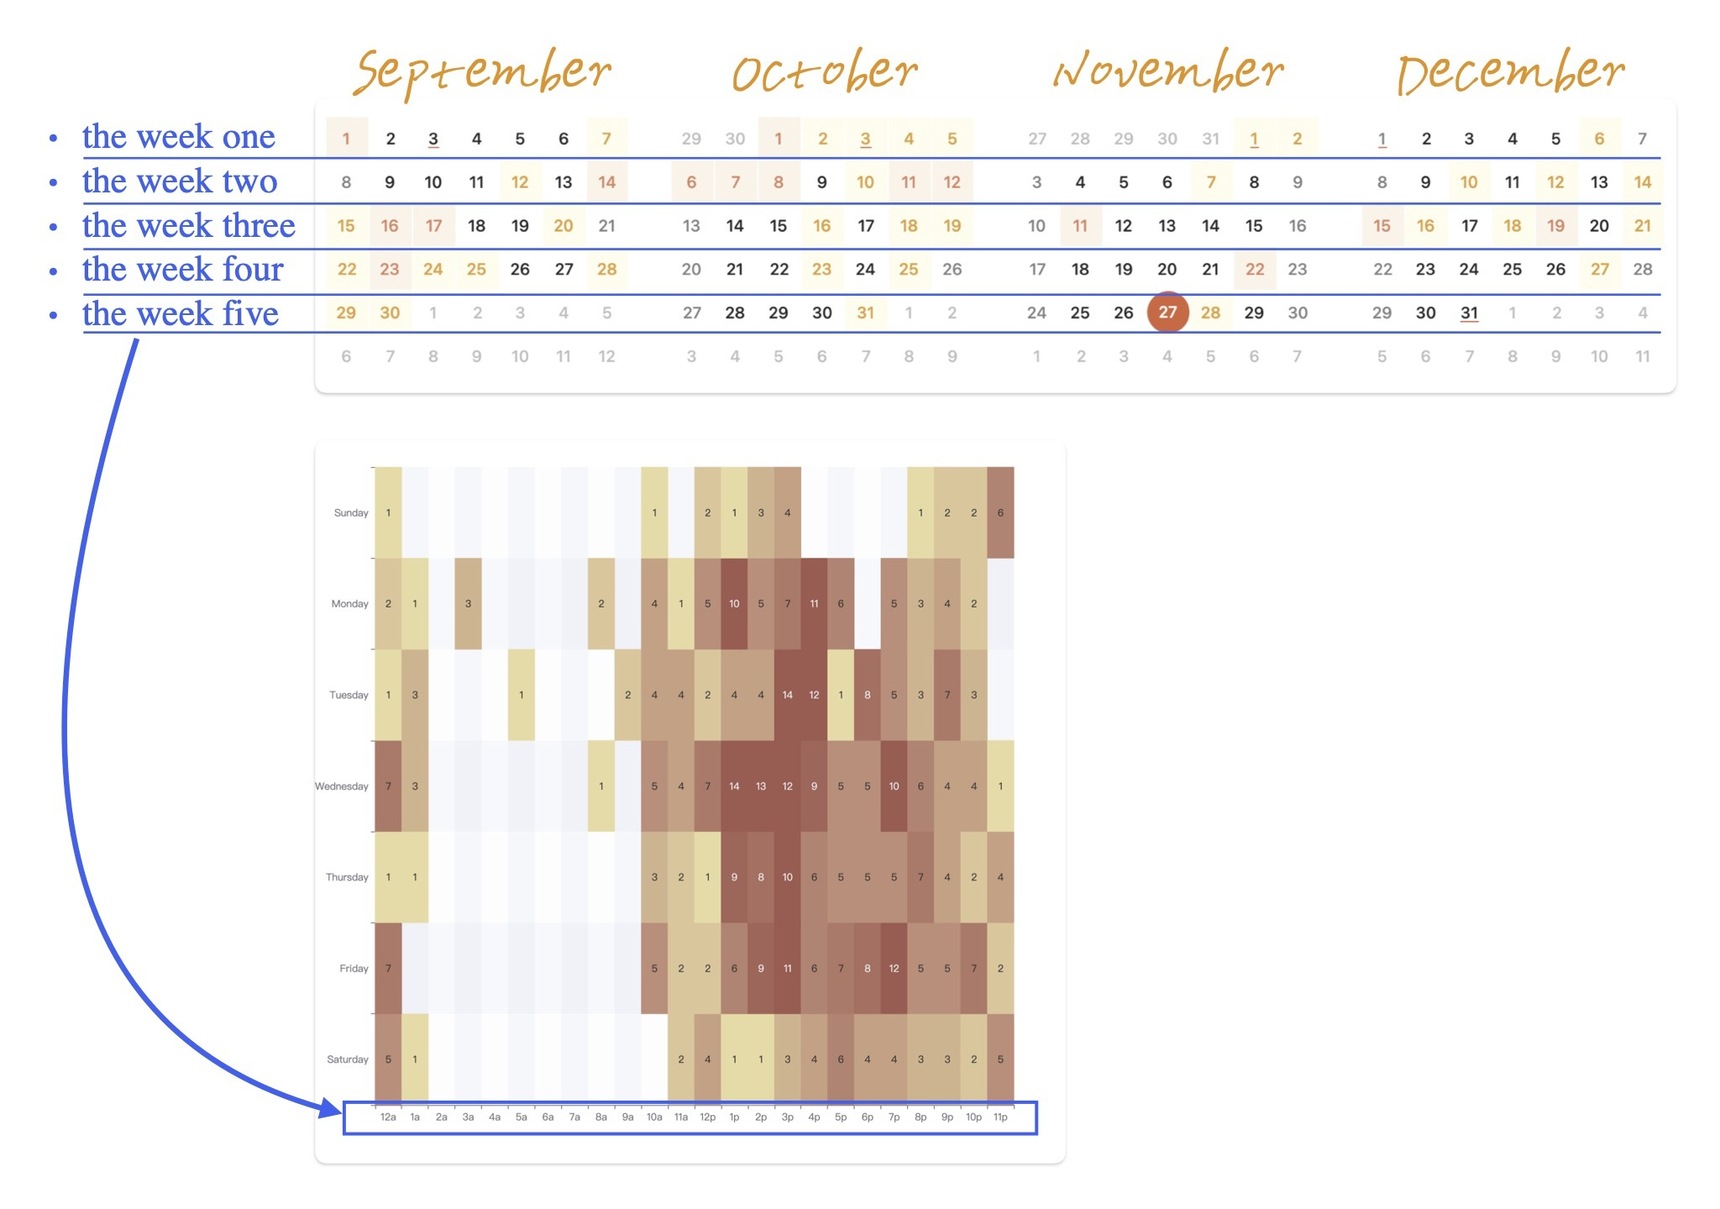
       I initially envisioned replacing the time on the X-axis in the example with the weeks of January. However, as shown in the calendar-style chart, the number of days in the first and last week of each month is inconsistent, which presents a challenge. Perhaps switching the X-axis to fixed time units (e.g., 24 hours, morning, or afternoon) might be relatively simpler. I look forward to hearing your thoughts.

      • Fred
      • 2 mths ago
      • Reported - view

        I originally thought like you did, that there can be 5 weeks in a month. And that does make things complicated. But since you asked for monthweek, my thinking was the month is the universe so everything starts at 1 and there are 28,30, or 31 days in a month. You can add a 5th division to separate into 4 even weeks then the extra. Or just make the 4th week a bit longer.

    • red_kite
    • 2 mths ago
    • Reported - view

    I don't know if I've translated and understood everything correctly. enclosed is a small DB with a suggestion for one year.

    • Alain_Fontaine
    • 2 mths ago
    • Reported - view

    To calculate which week of the month a specific day falls into:

    week(InputDate) - week(date(year(InputDate), month(InputDate), 1)) + 1
    
      • Fred
      • 2 mths ago
      • Reported - view

      Just an FYI, Ninox's week starts on Monday and ends on Sunday. So any month starting on Sunday (i.e. Sept 2024) will have 6 weeks according to this formula. Sep 1, 2024 is week 35 and Sept 30, 2024 is week 40.

      • Alain_Fontaine
      • 2 mths ago
      • Reported - view

       Exactly. The formula I proposed returns "1" for the first date, and "6" for the last one, as expected.

      • Fred
      • 1 mth ago
      • Reported - view

      Just letting people know that is what happens. So they shouldn't be surprised when they see a 6th week.

      • Alain_Fontaine
      • 1 mth ago
      • Reported - view

      This formula sometimes returns an incorrect result in january or in december. For the record, here is a better one:

      floor((day(InputDate) + weekday(InputDate - day(InputDate) + 1) + 6) / 7)
      
    • gold_cat
    • 1 mth ago
    • Reported - view

    Thank you, , for the table, and thanks to  and  for the ideas. I found that ECharts has a built-in heatmap with a calendar, and it looks quite good.

    I tried loading my database data into it, and it seems to have worked, so I’m sharing it with everyone. (It might contain some Chinese characters; you can try using ChatGPT to modify them—that’s what I did as well.)

    let getData := ((select 'table')[year('time') = year(today())] order by 'time');
    let firstday := weekday(date(year(today()), 1, 1)) + 1;
    let olnyweek := unique(for entry in getData do
                format(entry.'time', "YYYY-MM-DD")
            end);
    let newData := for riqi in olnyweek do
            let filteredData := getData[format('time', "YYYY-MM-DD") = riqi];
            let XSje := sum(filteredData.'number');
            {
                riqi: riqi,
                XSje: XSje
            }
        end;
    let formattedData := for data in newData do
            [data.riqi, data.XSje]
        end;
    let MaxData := for data in newData do
            data.XSje
        end;
    html("
    <head>
        <script src='echarts.min.js'></script>
        <style>
            html, body {
                margin: 0;
                padding: 0;
                width: 100%;
                height: 100%;
                overflow: hidden;
            }
            #main {
                width: 100%;
                height: 100%;
            }
    
            @media (max-width: 600px) {
                #container {
                    width: 100%;
                    height: 100%;
                    overflow-x: auto;
                    overflow-y: hidden;
                    -webkit-overflow-scrolling: touch;
                }
                #main {
                    width: 1200px;
                    min-width: 1200px;
                    height: 100%;
                }
            }
        </style>
    </head>
    <body>
        <div id='main'></div>
        <script>
            var myChart = echarts.init(document.getElementById('main'));
    
            var option = {
                tooltip: {
                    formatter: function(params) {
                        var date = new Date(params.value[0]);
                        var amount = params.value[1];
                        var formattedAmount = amount.toString().replace(/\B(?=(\d{3})+(?!\d))/g, ',');
                        return date.getFullYear() + '年' + (date.getMonth() + 1) + '月' + date.getDate() + '日<br>' + formattedAmount + ' 元';
                    }
                },
                visualMap: {
                    show: true,
                    min: 0,
                    max: " +
    max(MaxData) +
    ",
                    type: 'continuous',
                    orient: 'vertical',
                    right: '1%',
                    top: 'center',
                    text: ['高', '低']
                },
                calendar: {
                    top: '20%',
                    left: '4%',
                    right: '6%',
                    cellSize: ['auto', 25],
                    range: new Date().getFullYear(),
                    itemStyle: { borderWidth: 0.5 },
                    splitLine: {
                        show: true,
                        lineStyle: { width: " +
    firstday +
    ", color: '#474647', type: 'solid' }
                    },
                    yearLabel: { show: false },
                    dayLabel: { firstDay: 1, nameMap: ['日', '一', '二', '三', '四', '五', '六'] },
                    monthLabel: {
                        nameMap: ['1月', '2月', '3月', '4月', '5月', '6月', '7月', '8月', '9月', '10月', '11月', '12月']
                    }
                },
                series: {
                    type: 'heatmap',
                    coordinateSystem: 'calendar',
                    data: " +
    text(formattedData) +
    "
                }
            };
    
            myChart.setOption(option);
    
            window.addEventListener('resize', function() {
                myChart.resize();
            });
        </script>
    </body>
    ")