
Gantt Table View
This looks like the tool for showing Timelines. I'm using MacOS app 3.19.34, have the appropriate fields and created the View, but I want to make some changes to how it is shown. Looking on-line suggests several options to adjust this, but all I can do is change the fields/columns used.
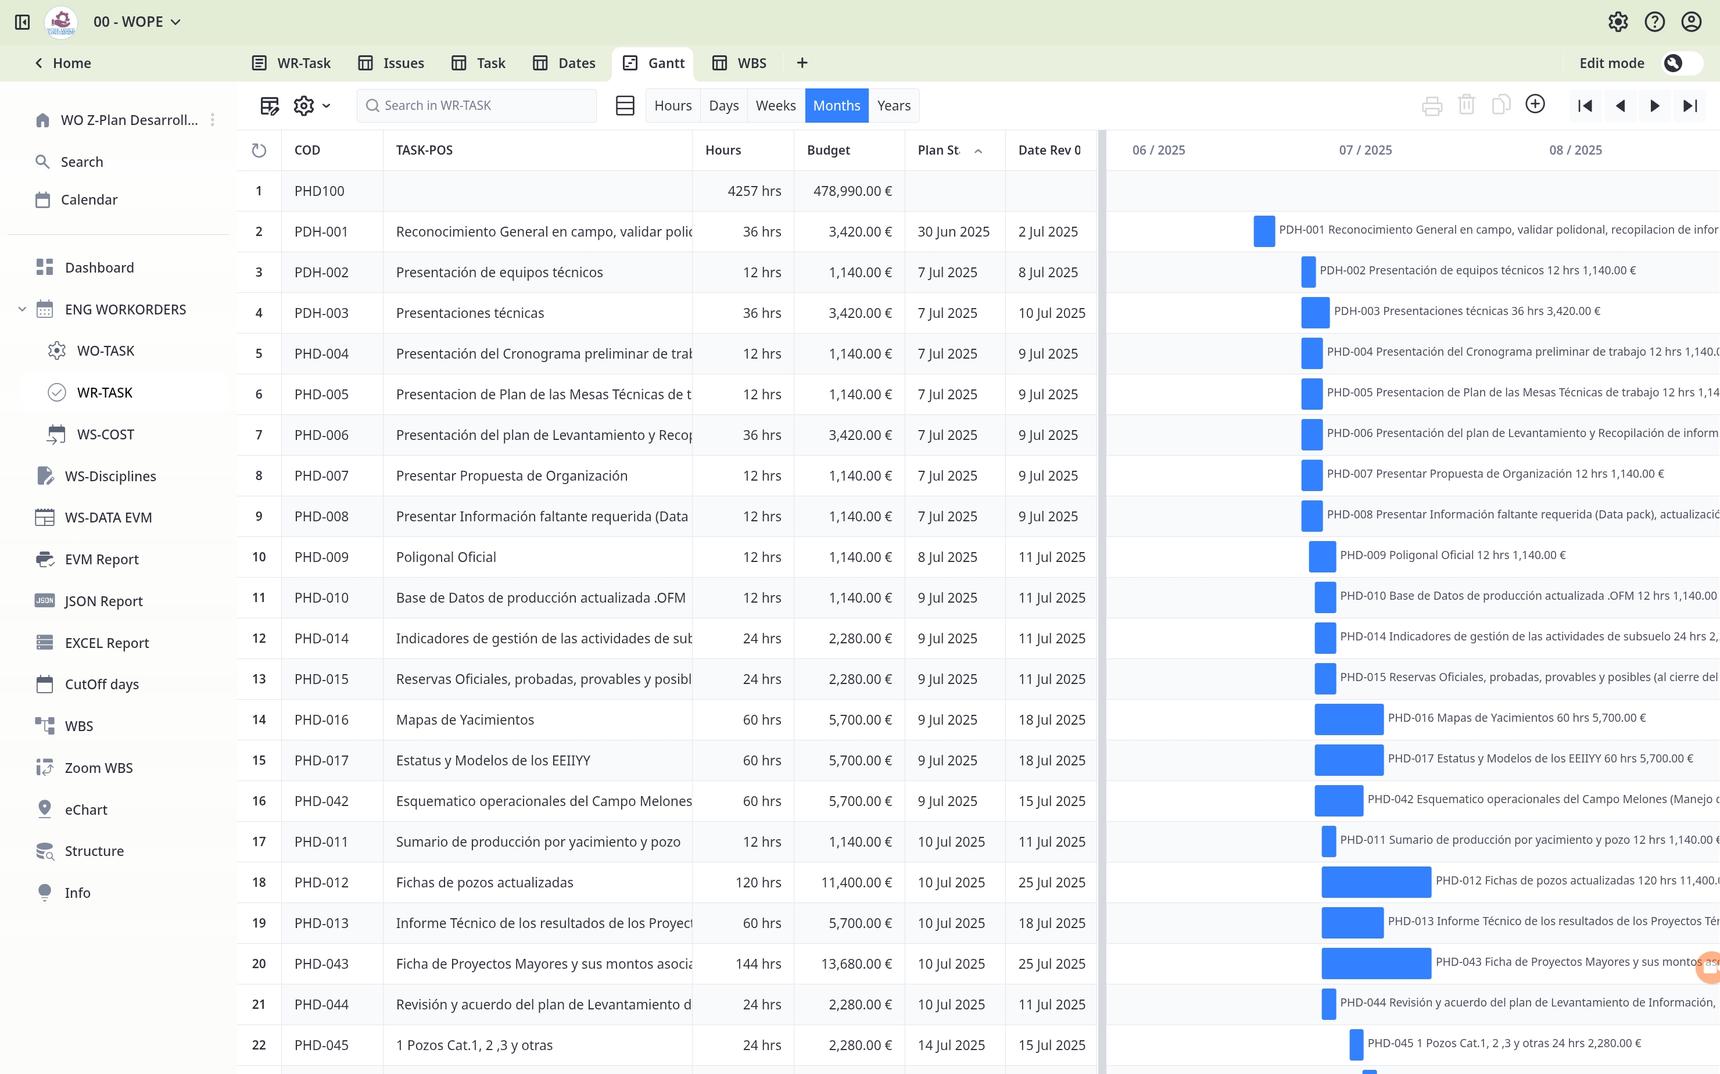
In particular, I have seen screenshots where descriptive text (a field no doubt) is placed on and within the actual bar, whereas for me it is simply added just beyond the end of the bar.
The total lack of documentation on this feature is made worse by explanations that simply don't match reality.
Can anyone provide any insight into how a Gantt chart can be configured, apart from editing the list of displayed columns?
2 replies
-
Sample display
-
Yes that's pretty much as I have got. However, I've seen many mentions of additional configuration options and I have specifically seen a screen capture showing descriptive text, that I assume to be one or more fields, on top of the bar, i.e. contained within the blue bar which as far as I've been able to figure is impossible. Would someone bother to photoshop a screen grab just to fool others? Seems unlikely, so how can that be achieved?
Is it possible to reduce the width of the columns? I have 'events' spanning several years and narrower annual columns would make for far better viewing, but I can see no way to do that.
Content aside
- 5 hrs agoLast active
- 2Replies
- 6Views
-
2
Following