
Concatanate - Two For loop -
let check := dialog(" ATENCION ", " ¿Confirma el SETUP de la tabla de AVANCES_PROYECTO ? ", ["Si", "No"]);
if check = "Si" then
    for loop1 in select BASELINE do
        'Date:' := loop1.Data_Date;
        let xDoc := first(select EVM);
        let xFld1 := xDoc.'Progress Project';
        let xFld2 := xDoc.Week;
        let xFld3 := xDoc.DataDate;
        let i := (create PLAN_CURVE);
        i.(Base_PLAN := xFld1);
        i.(Week_PLAN := xFld2);
        i.(Date_PLAN := xFld3)
    end
else
    closeRecord()
end
After this loop1 I need other one loop, how can I do that.
15 replies
-
Loops can be arranged one after another, or nested one inside another. It all depends on your use case.
-
Do you want the 2nd loop to run regardless of the if statement? Then it would look something like:
else
    closeRecord()
end;

for loop2 in select 'CUTOFF-DATES' do
I would think that you should rename the 2nd loop variable to loop2 so as not to get confused about which loop you are in.
Remember to close a function you have to put a “;” at the end. Then you can start another.
-
For some reason I didn't see the very end of the code.
1) Please turn on line numbers when you Add Code Block. Click on the gear icon when editing the code and put a check next to line number.
2) You need a 2nd if statement for loop2. You have an else but no if to start it.
3) or you put the 2nd loop into the first else.
-
Not checked but this should work. Notice how much shorter this format is...
let check := dialog(" ATENCION ", " ¿Confirma el SETUP de la tabla de AVANCES_PROYECTO ? ", ["Si", "No"]);
if check = "Si" then
    for loop1 in select BASELINE do
        'Date:' := loop1.Data_Date;
        let xDoc := first(select EVM);
        (create BASELINE_CURVE).(
        Base_PLAN := xDoc.'Progress Project';
        Week_PLAN := xDoc.Week;
        Date_PLAN := xDoc.DataDate)
    end;
    for loop2 in select 'CUTOFF_DATES' do
        'Date:' := loop2.Date_Baseline;
        let xDoc := first(select EVM);
        (create PROGRESS).(
        Progress_Real := xDoc.'Real Progress';
        Plan_Value := xDoc.Plan_Value;
        Earned_Value := xDoc.Earned_Value;
        CPI_Project := xDoc.CPI_Project;
        SPI_Project := xDoc.SPI_Project;
        Week := xDoc.Week;
        Date := xDoc.DataDate)
    end
else
    closeRecord()
end
Regards John
-
The new Script editor is not yet available to IOS and Android tablet.
We have already added this to our feature request list.
Kind regards,
-
I’m talking about adding line numbers in the forum not the app.
-
John Halls
Fred
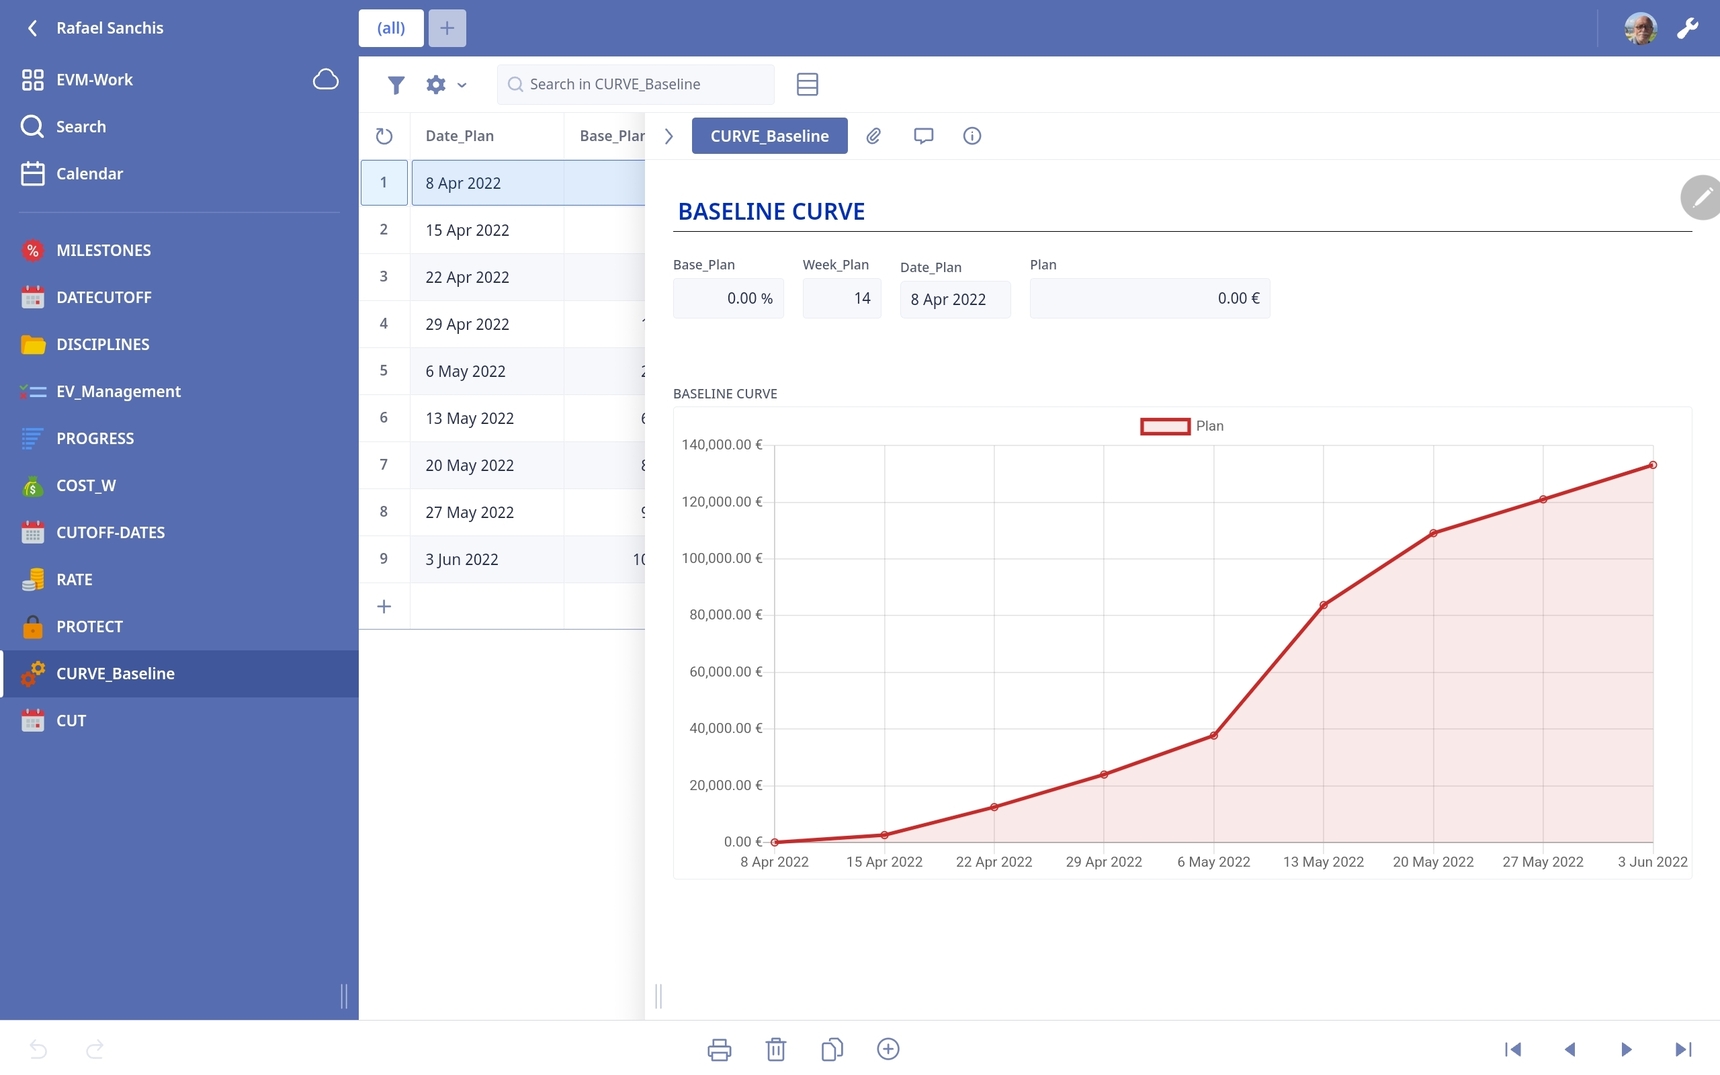
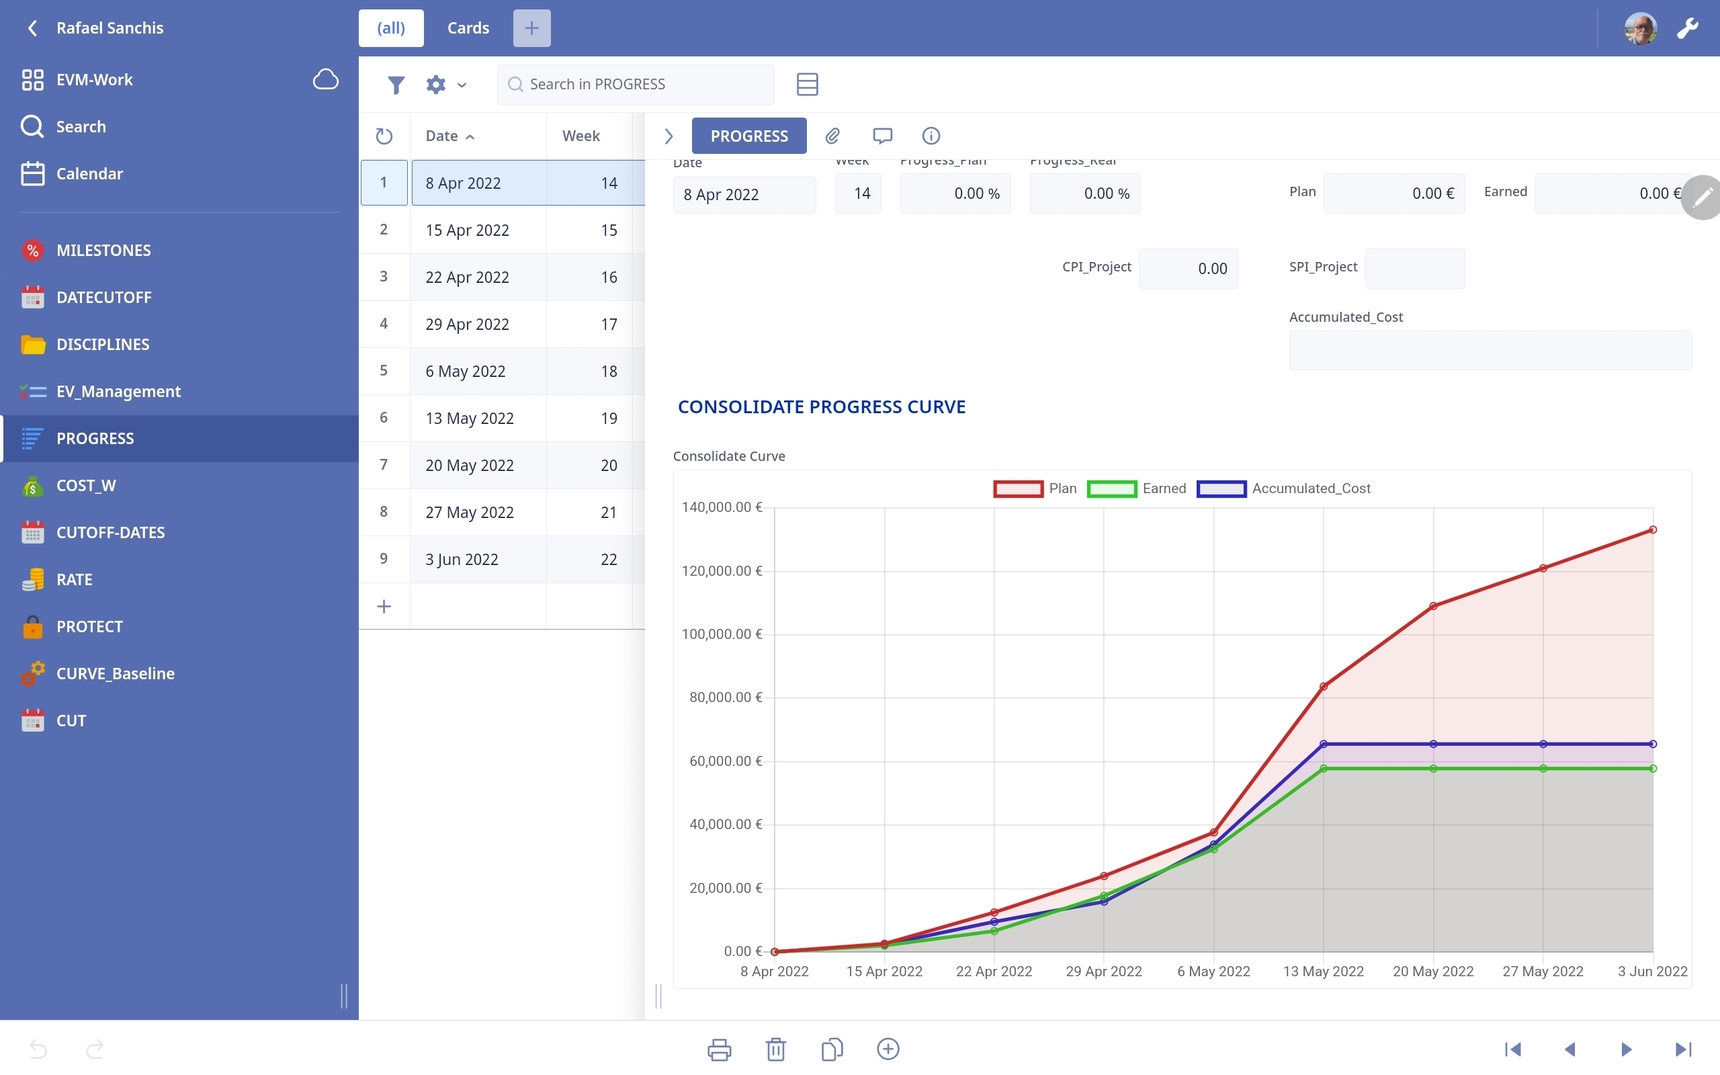
Hi again, The First Graph I generate with a loop is the Baseline Cost Curve (Alone), the second is the same generate with a one loop, I have 3 Curve the Baseline Cost Curve, plus the Earned Curve and the Actual Cost, these last two Curve need two finish on Date of CutOff Date 13May.
I try two combine two loop1 one for only Baseline (with all weeks 9 ) and second loop2 for the other two Curve with the only cutoff date (in these case only only 6 Weeks).
There are some way two combine these two loop to generate the Curve.
And please sorry but is complicated generate this last two Curve.
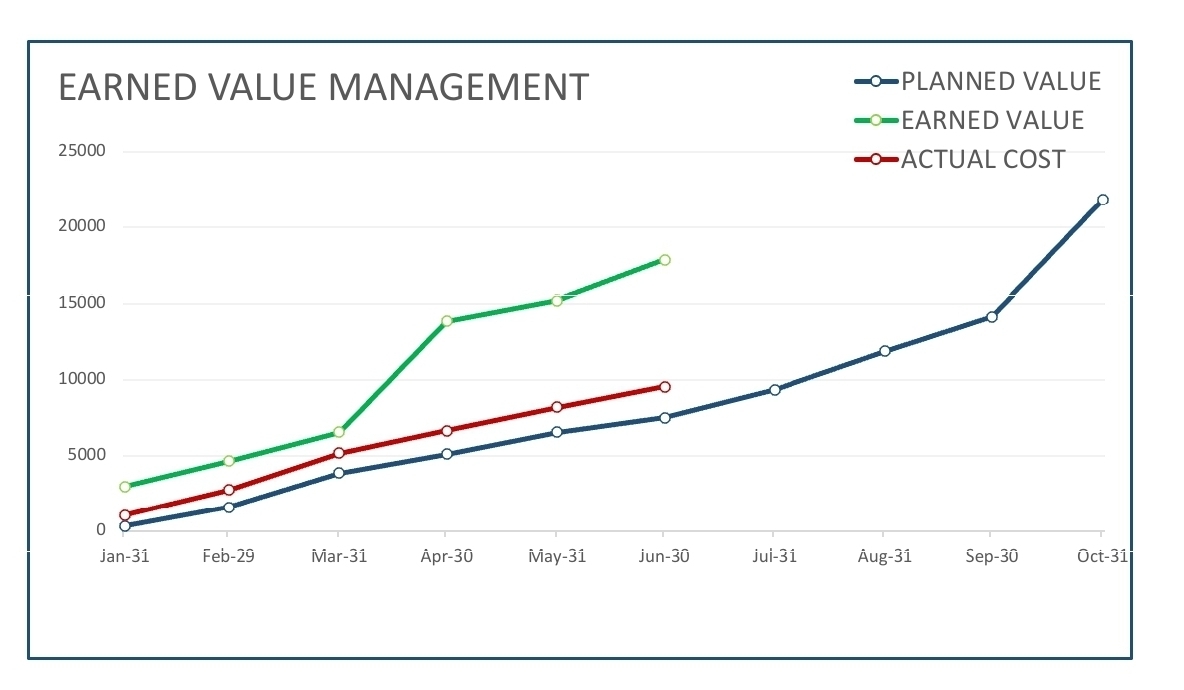
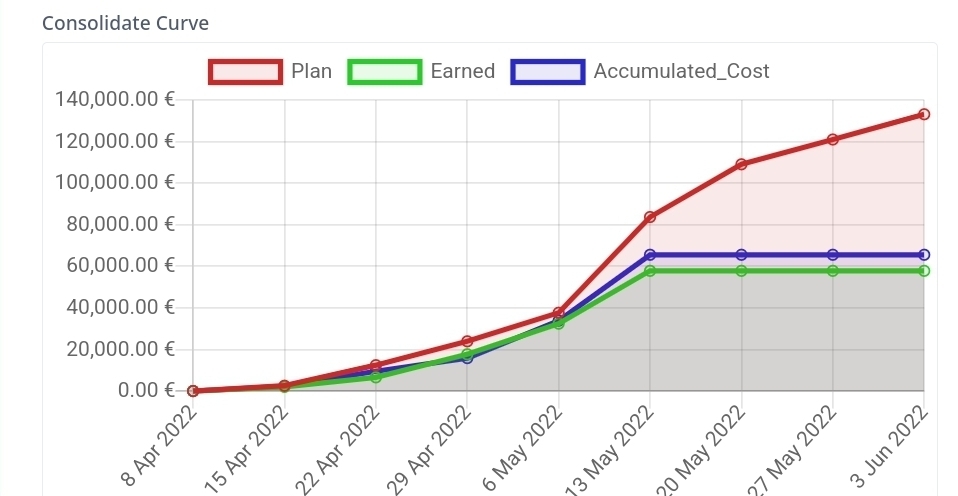
I need represent the Curve like the last Graph.
If this is not posible, I will not wasted any more time.
-
Can you post the code you are working from?
-
Charts are not my thing so I don't think I can help out too much.
I tried creating a formula that does something similar where you create the records in a table then use the same table to populate another table and was able to do it without creating a doubling the 2nd set.
Rafael said:
I try to generate the the other two Curve (I use only the weeks I cutoff) but double the result.I'm not sure I follow you here. What do you mean by double the results? In which table?
-
let check := dialog(" ATENCION ", " ¿Confirma el SETUP de la tabla de AVANCES_PROYECTO ? ", ["Si", "No"]);
if check = "Si" then
    for loop1 in select 'CUTOFF-DATES' do
        'Date:' := loop1.Data_Date;
        let xDoc := first(select EV_Management);
        (create PROGRESS).(
            Progress_Plan := xDoc.'Progress Project';
            Progress_Real := xDoc.'Real Progress';
            Plan := xDoc.Plan_Value;
            Earned := xDoc.Earned_Value;
            Accumulated_Cost := xDoc.Total_Cost;
            CPI_Project := xDoc.CPI_Project;
            SPI_Project := xDoc.SPI_Project;
            Week := xDoc.Week;
            Date := xDoc.DataDate
        )
    end
else
    closeRecord()
end
Fred
With that Code I generate the 3 Curves (Plan, Earned and Cost)
The Plan is OK, the Earned and Cost is ok útil 13 May, finish here the next cutoff day New values appear.
Thank Fred the best to close this here, generate this curve in Ninox is very complicated in excel I take a minute without problem.
Thank a lot for yor time with that.👋
Content aside
- Status Answered
- 4 yrs agoLast active
- 15Replies
- 138Views
-
3
Following