0

Duration chart

Hi ! Is it possible to calculate a duration to display it on a graph?

I would like to have a graph that displays the time worked each month. This calculation is based on the "Durée" field of the "Activités" table. Each record in the activity table contains an appointment date. From this appointment date, I extract the duration in the "Durée" field.

I would like my dashboard to show the total duration month by month in the form of a graph.

I was thinking of something like this below but it doesn't work :

Graph formula : 

let filterStart := 'Début du filtre';
let filterEnd := 'Fin du filtre';
select 'Activités'
    where date('Date du rendez-vous') >= filterStart and
        date('Date du rendez-vous') <= filterEnd and
    Statut = 6

Statut = 6 is equal to Status completed

Column 1 : (regroup)

format('Date du rendez-vous', "YYYY-MM")

Column 2 : (sum)

'Durée'

The sum of the durations month by month is not done.

Thanks for your help.

10 replies

null
    • Créateur de bien-être
    • Sebastien_Guillet
    • 1 yr ago
    • Reported - view

    I still haven't been able to find a solution. If anyone has an idea, it will be with pleasure!

      • Ninox developper
      • Jacques_TUR
      • 1 yr ago
      • Reported - view

      Sébastien Guillet Could you post a database with your example to see what happens?

      • Ninox developper
      • Jacques_TUR
      • 1 yr ago
      • Reported - view

      Sébastien Guillet I use a similar method on my dashboard and it works perfectly. Are you sure that "Duration" is of type number? You can use the debugValueInfo() function to check it.

      • Créateur de bien-être
      • Sebastien_Guillet
      • 1 yr ago
      • Reported - view

      Jacques TUR I deleted everything that did not relate to my request and deleted my customers' data.

      My problem is on the second graph of the "Tableau de bord" table and the data is retrieved from the "Formations" table

      • Créateur de bien-être
      • Sebastien_Guillet
      • 1 yr ago
      • Reported - view

      Jacques TUR I tried like this : debugValueInfo(select Formations where 'Durée')

      Here's the result : nid(["V1","V2","V3","V4","V5","V6","V7","V8","V9","V10","V11","V12","V13","V14","V15"])

      I don't quite understand what that means...

      • Créateur de bien-être
      • Sebastien_Guillet
      • 1 yr ago
      • Reported - view

      Jacques TUR Ps: I do translations with Google Translate, I hope everything is understandable.

      • Ninox developper
      • Jacques_TUR
      • 1 yr ago
      • Reported - view

      Sébastien Guillet No problem, everything is understandable. I use DeepL, because I think it is more accurate.

    • Ninox developper
    • Jacques_TUR
    • 1 yr ago
    • Reported - view

    It seems that the Ninox grapher does not accept the time value, only the numbers. I create a function to get the number of hours from the Duration :

    number('Durée') / (1000 * 60 * 60)

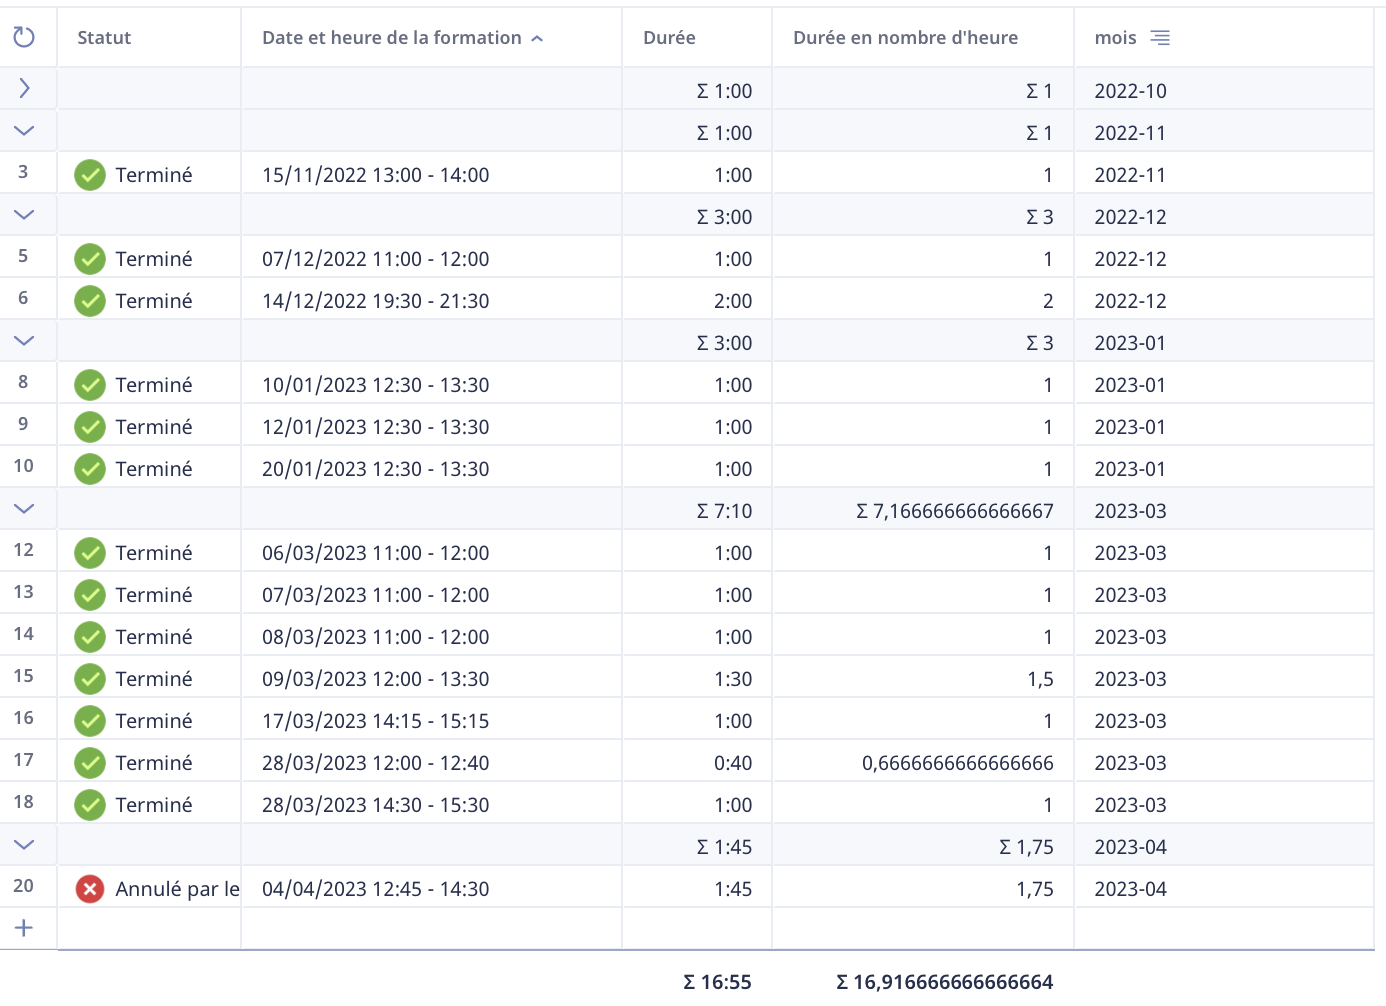
    Here is view with 'Durée' and 'Durée en nombre d'heure' :

    I have added this value to the columns of the graph:


    And now it work fine : 

    • Créateur de bien-être
    • Sebastien_Guillet
    • 1 yr ago
    • Reported - view

    It works perfectly. I added a round() function to make it easier to visualize on the chart. Thanks a lot for your help !

    • Ninox developper
    • Jacques_TUR
    • 1 yr ago
    • Reported - view
    Sébastien Guillet said:
    Here's the result : nid(["V1","V2","V3","V4","V5","V6","V7","V8","V9","V10","V11","V12","V13","V14","V15"])
    I don't quite understand what that means...

     this is the list of records returned by the select() function.
    S is the internal identifier of the table "Formations" and the numbers correspond to each unique identifier of the records (value of the field "id").

Content aside

  • Status Answered
  • 1 yr agoLast active
  • 10Replies
  • 153Views
  • 2 Following