
HTML Pivot Table
Hello everyone,
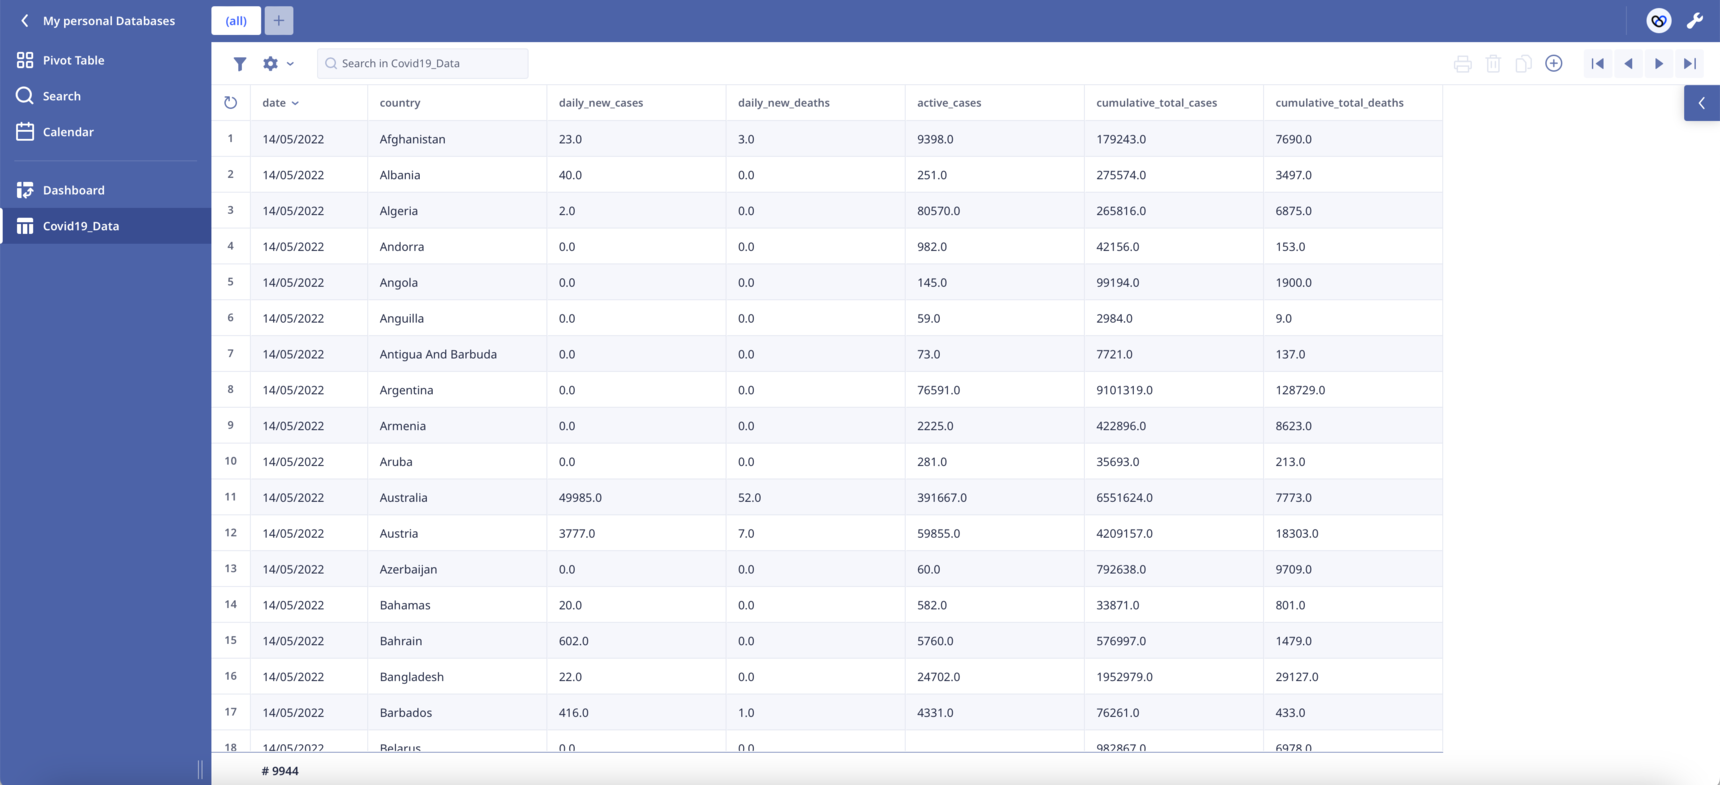
In my application, time series data (screenshot 1) are often needed to be managed and presented in a practical way.
Since Ninox does not yet allow us to insert a pivot table view into a page, I thought of creating an HTML table for time series data (screenshot 2).
Below is the code inside a function field:
let x := Covid19_Data;
let y := rsort(unique(x.date));
let header := for loop1 in y do
        "<th>" + loop1 + "</th>"
    end;
let body := for loop2 in unique(x.country) do
        "<tr>
        <td style='background-color: #ffffff'>" +
        loop2 +
        "</td>" +
        for loop3 in y do
            let z := last(x[country = loop2 and date = loop3]);
            "<td><span onclick=""ui.popupRecord('" + raw(z.Id) +
            "')""; style=""cursor: pointer;"">" +
            z.daily_new_cases +
            "</span></td>"
        end +
        "</tr>"
    end;
html("<head>
<style>
    .pivot-table {
        border-collapse: collapse;
        width: auto;
        table-layout: auto; /* Column width based on content */
        white-space: nowrap; /* Prevent text wrapping */
    }
    .pivot-table th, .pivot-table td {
        border: 1px solid #dddddd;
        text-align: center;
        padding: 8px;
    }
    .pivot-table th {
        background-color: #ffffff;
        position: sticky;
        top: 0;
        z-index: 2; /* Higher z-index to ensure it's above other elements */
    }
    .pivot-table th:first-child {
        background-color: #ffffff;
        font-weight: bold;
        position: sticky;
        left: 0;
        z-index: 3; /* Higher z-index to ensure it's always on top */
        width: 200px; /* Custom width for the first column */
    }
    .pivot-table td:first-child {
        background-color: #ffffff;
        font-weight: bold;
        position: sticky;
        left: 0;
        z-index: 1; /* Lower z-index to ensure it's below the first column header */
        max-width: 200px; /* Set maximum width for the first column */
        overflow: hidden; /* Hide overflow content */
    }
</style>
</head>
<body>
<div>
<table id='pivotTable' class='pivot-table'>
    <tr>
        <th></th>" +
header +
"
    </tr>" +
body +
"
</table>
</div>
</body>")
Although the above code works very well with small datasets, it has performance issues with large ones.
For example, the attached sample database (9944 records) takes about 20 seconds to fetch the data.
Any suggestions for improvement from the experts are welcome 🙂.
20 replies
-
UPDATE: 10X speed improvement!
I improved the speed of data display by at least ten times, from about 20 seconds to less than 2 seconds, by removing the nested “for” loop inside the body variable 😀.
let x := (Covid19_Data order by -date); let header := for loop1 in rsort(unique(x.date)) do "<th>" + loop1 + "</th>" end; let body := for loop2 in unique(x.country) do let y := x[country = loop2]; "<tr> <td style='background-color: #ffffff'>" + loop2 + "</td>" + y.("<td><span onclick=""ui.popupRecord('" + raw(Id) + "')""; style=""cursor: pointer;"">" + daily_new_cases + "</span></td>") + "</tr>" end; html("<head> <style> .pivot-table { border-collapse: collapse; width: auto; table-layout: auto; /* Column width based on content */ white-space: nowrap; /* Prevent text wrapping */ } .pivot-table th, .pivot-table td { border: 1px solid #dddddd; text-align: center; padding: 8px; } .pivot-table th { background-color: #ffffff; position: sticky; top: 0; z-index: 2; /* Higher z-index to ensure it's above other elements */ } .pivot-table th:first-child { background-color: #ffffff; font-weight: bold; position: sticky; left: 0; z-index: 3; /* Higher z-index to ensure it's always on top */ width: 200px; /* Custom width for the first column */ } .pivot-table td:first-child { background-color: #ffffff; font-weight: bold; position: sticky; left: 0; z-index: 1; /* Lower z-index to ensure it's below the first column header */ max-width: 200px; /* Set maximum width for the first column */ overflow: hidden; /* Hide overflow content */ } </style> </head> <body> <div> <table id='pivotTable' class='pivot-table'> <tr> <th></th>" + header + " </tr>" + body + " </table> </div> </body>") -
Thank you , I appreciate your insights.
While I understand the benefits of creating a new JSON object, in my specific case, the data is already there and requires no further configuration.
So far, I have managed to get rid of the second loop, so I am down to one. How could I have created the table data without at least one loop?
With the changes to the code, it takes about 30 seconds to display 184,787 records so far.
The new database is attached for anyone interested in experimenting with this extensive dataset.
let x := ((Covid19_Data order by -date) order by country); let tdata := "<tr><th></th>" + unique(x.("<th>" + date + "</th>")) + "</tr>" + for loop1 in unique(x.country) do let y := x[country = loop1]; "<tr> <td style='background-color: #ffffff'>" + loop1 + "</td>" + y.("<td><span onclick=""ui.popupRecord('" + raw(Id) + "')""; style=""cursor: pointer;"">" + daily_new_cases + "</span></td>") + "</tr>" end; html("<head> <style> .pivot-table { border-collapse: collapse; width: auto; table-layout: auto; /* Column width based on content */ white-space: nowrap; /* Prevent text wrapping */ } .pivot-table th, .pivot-table td { border: 1px solid #dddddd; text-align: center; padding: 8px; } .pivot-table th { background-color: #ffffff; position: sticky; top: 0; z-index: 2; /* Higher z-index to ensure it's above other elements */ } .pivot-table th:first-child { background-color: #ffffff; font-weight: bold; position: sticky; left: 0; z-index: 3; /* Higher z-index to ensure it's always on top */ width: 200px; /* Custom width for the first column */ } .pivot-table td:first-child { background-color: #ffffff; font-weight: bold; position: sticky; left: 0; z-index: 1; /* Lower z-index to ensure it's below the first column header */ max-width: 200px; /* Set maximum width for the first column */ overflow: hidden; /* Hide overflow content */ } </style> </head> <body> <div> <table id='pivotTable' class='pivot-table'> " + tdata + " </table> </div> </body>") -
said:
it takes about 30 seconds to display 184,787 records so far.whaaaat? 184K records?
wow
it took 9 secs to load on my M2 MBPro.
-
I have tried tweaking the code further by using "do as server," "do as transaction," and "cached()," but nothing seems to improve things.
Maybe it's time to consider "pagination." This is an entirely new area for me, but you can only build an HTML table if you consider its performance when using large datasets 😥.
-
My computer at work struggles to display this data. I get an 'out of memory' message
-
I use this code
let me := this; let Rows := unique(('History Hours' order by 'Staff:').'Staff:'); let Cols := unique(('History Hours' order by yw).yw); "--------------CSS---------------"; let css := "<style> table,th, td { border:thin solid #a0a0a0; border-collapse:collapse; } th{ background-color:#f1f3f4; text-align:center; padding:0.1em 0.6em; } tr:nth-child(odd) {background-color:#e4ebf2;} td{ text-align:right; padding:0.1em 0.8em; font-family:Courier; } th:nth-of-type(1) { position:sticky; overflow-x:auto; white-space:nowrap; left:-1em; text-align:left; } .grey {background-color:silver;} </style>"; "------------Content------------"; let content := " <table> <tr> <th class ='stop'>Year / Week</th> " + for c in Cols do "<td>" + c + "</td>" end + "<td>Total</td> </tr> " + for r in range(0, length(Rows)) do "<tr><th>" + item(Rows, r) + "</th>" + for c in range(0, length(Cols)) do "<td>" + sum(me.'History Hours'['Staff:' = item(Rows, r) and yw = item(Cols, c)].'Hours:') + "</td>" end + "<td class = 'grey'>" + sum(me.'History Hours'['Staff:' = item(Rows, r)].'Hours:') + "</td> </tr>" end + " <tr><th>Total</th>" + for c in Cols do "<td class = 'grey'>" + sum(me.'History Hours'[yw = c].'Hours:') + "</td>" end + "<td class = 'grey'>" + sum(me.'History Hours'.'Hours:') + "</td></tr> </table>"; html(css + content) -
Follow this
-
your table is nice and offers new features for integration (e.g Choice Options). It looks like you are also using an HTML table with the same logic (you can call it Pivot or Crosstab).
I see in your code that you're also using a nested for loop, so I'm not expecting better load times.
So the question remains, what is the most efficient way to create a pivot or crosstab table so that it can handle a large amount of data?
-
So I've been racking my brain on how to make things go faster and one way I thought of is to create a table called byCountry, then link all of the Covid19 data to their respective country. That way I am using the power of relationships and not trying to sort/filter 184K records.
Check out the DataPresentation table in the attached DB.
Here are the load times on my MBP M2 running 3.12.2 app and db stored on iCloud (because I don't have a cloud account that can load 184K records).
Time
1st
2nd
3rd
Dashboard
6.3
7.0
7.2
Data Presentation
3.2
3.4
2.6

Content aside
- 2 yrs agoLast active
- 20Replies
- 1045Views
-
4
Following