
Dashboard Template
Hello everyone!
After the post, I decided to start a new one. This will make it easier to follow the changes.
New features have been added:
- Sticky buttons. Thanks to CSS hacks, I was able to make the buttons component sticky. Now the buttons always remain visible to the top of the page as we scroll down.
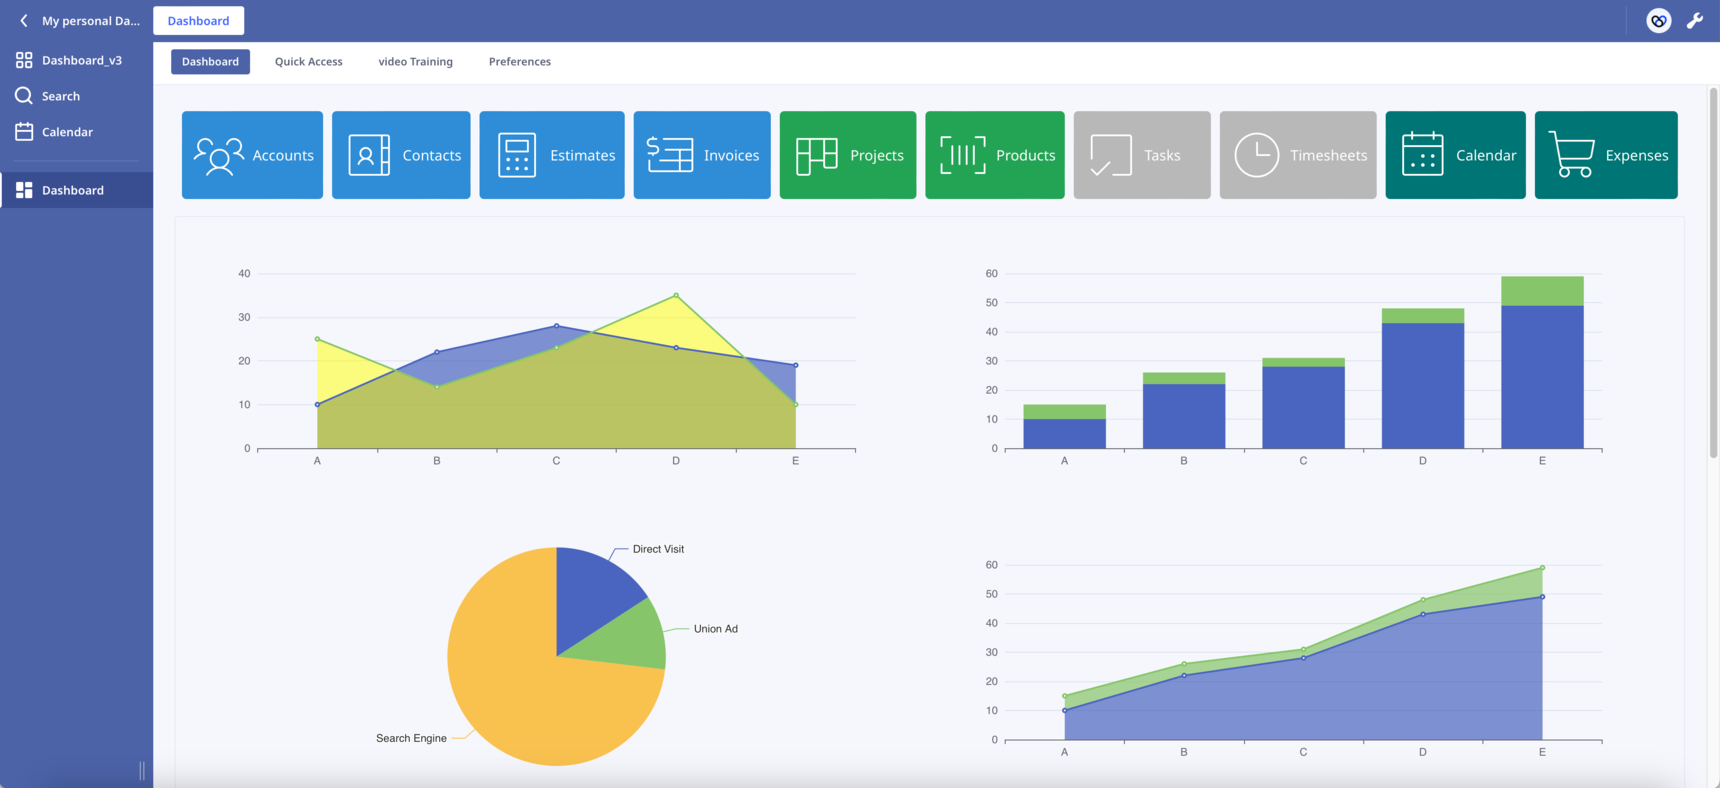
- Scroll into View. By clicking a button the page automatically scrolls into the correspoding section. In the attached database press the first button "Accounts" to see it in action.
The combination of the above two features has the potential to transform the way we design our Dashboards. Like the one-page websites, we can present our content in sections on one long Dashboard.
In Safari works but I haven't check it in other browsers. Let me know if you find any bug.
What other functionalities would you like to see?
Leave here your suggestions, ideas or improvements!
Enjoy!
224 replies
-
Version 6.0
New feature:
Real-time weather data right to your home section by calling the tomorrow.io API. I've set the location to New York just to show you what it looks like! You can easily change the location 'Value' field inside the 'Settings' subtable. It accepts the following formats:
- Latitude and Longitude (Decimal degree)
location=42.3478, -71.0466 - City name
location=new york - US zip
location=10001 US(2-letter code based on ISO-3166) - UK postcode
location=SW1
I'm happy to leave my API Key so that everyone has a chance to test out the service. Just a quick heads-up, though, there are limits on requests (3/sec, 25/hour, 500/day). But there is a free account tier, so just create one and paste your API Key inside the 'Settings' subtable.
This company seems promising but I am not sure how accurate the results we get are. If you know of a better weather API, I'd love to hear about it!
Improvements:
- Responsive layout for both the 'Home' CSS flexbox and 'Dog Stats' CSS grid. I used @media CSS queries to make it all work together seamlessly. On smaller devices, the layouts switch to a single column, which is great for viewing the charts one after the other.
- No dependencies on external sources. I've downloaded and saved the eCharts js library, the Phosphor icons stylesheet, and the weather codes into the 'Sources' subtable for you.
All the best! 🙂
- Latitude and Longitude (Decimal degree)
-
Version 7.0
Maps:
Hello everyone,
I'm really happy to share the latest version of Dashboard with you because I've incorporated a feature that I'm so excited about and I hope you'll love it too! The ability to display dynamic maps within Ninox is something many of us have been asking for and I'm so pleased to present the leaflet.
The Leaflet is a well-known, mature, super lightweight JavaScript mapping library with an active community. It's open-source and it gives us the power to do amazing things like add markers, popups, overlay lines, and shapes, use multiple layers, zoom, pan, and so much more. You can find plenty of examples in this free online book. As you can see in the screenshot, the map automatically shows markers for each address in the 'Accounts' table (on click, a nice popup appears that displays the Name).
Leaflet doesn't provide maps, but don't worry! It's provider-agnostic, which means you can easily call a map tiles API to get the map you need. Of course, you can use the OpenStreetMap API, which is completely free and open-source. Their maps are raw (precision but not neat), but they're great!
I've been looking into this a bit, and I've found two companies that might be worth checking out: Stadia Maps and MapTiler. I'm going with the Alidade Smooth-style map from Stadia Maps. I just love its muted color scheme and fewer points of interest, which makes it ideal for data presentation. If you want to use any of their maps, create a free account and copy their API call URL (including your API key) inside the 'Settings' subtable. I'll leave my API key for now, so you can see how it works.
I was wondering if you think it might be worth trying to download the library and make it work from the Ninox backend. I gave it a go myself, but I couldn't get it to work. Maybe the issue has to do with some icons that are used by the library, but I'm not sure how to modify the code to access them from a Ninox shared link. I've noticed that the Leaflet map hides the option wrench of the parent Ninox element, which we could probably fix by downloading the library and modifying the z-index values. Either way, it's not a big deal, but I'd love to hear your thoughts!
I've already centred the map on Madrid for you, so you can easily test it! Let me know if there's anything else I can help with.
could this particular implementation meet your needs in China as well?
I saw your earlier post about using Google Maps with multiple markers. I was just wondering if you think Leaflet could be a cheaper alternative that's also functional and powerful. I'd love to hear your thoughts!
Enjoy! 🙂
-
Version 7.1
Map improvements:
On mouse hover, the marker displays a tooltip with the first and last name of the corresponding 'Account' record.
On mouse click, the corresponding 'Account' record popups.
Have fun!🙂
-
Version 7.2
Map improvements:
Hey there! You can now add some gorgeous custom icons to your map! Have fun finding or making your favorite icon and save it inside the Dashboard Photos subtable. Then, create a sharing URL and paste it into the respective code field.
Enjoy!🙂
-
said:
Then, create a sharing URL and paste it into the respective code field.How to create shared links?
-
Version 7.3
Map improvements:
Hi everyone, custom markers are a great way to get creative since any image can be a marker on our map. However, if you want each point to have its unique one, it can become a bit time-consuming since you must introduce a new PNG file for each. In this version, I've added a few cool features to make the map more functional.
- Circle markers: The component lets you draw circles with a radius you specify in pixels (so the size in meters changes with zoom). You can use it to set the radius, width, colour, fill colour, opacity, and so on.
- GeoJSON: This is a special type of JSON object that's used to represent vector geometries, with or without non-spatial attributes. GeoJSON is a really popular format for mapping data, and Leaflet is great at handling it. Since Ninox scripting makes it so easy to construct JSON objects, we can present any data from our database on the map in whatever way we want. On top of that, we can also import external GeoJSONs. If you want to create your own, there's a really easy way to do it with geojson.io.
- Multiple maps: You can load a few different base maps, so the user can choose one that suits them best.
- Filtering and grouping: The library can filter the data based on geojson properties, which means we can create groups and show them on the map in a selective way.
In my example, you'll find a layer control panel in the top right corner where you can choose a base map and filter the markers based on the status field of the Accounts table.
Enjoy!🙂


Content aside
-
12
Likes
- 4 mths agoLast active
- 224Replies
- 5041Views
-
27
Following