
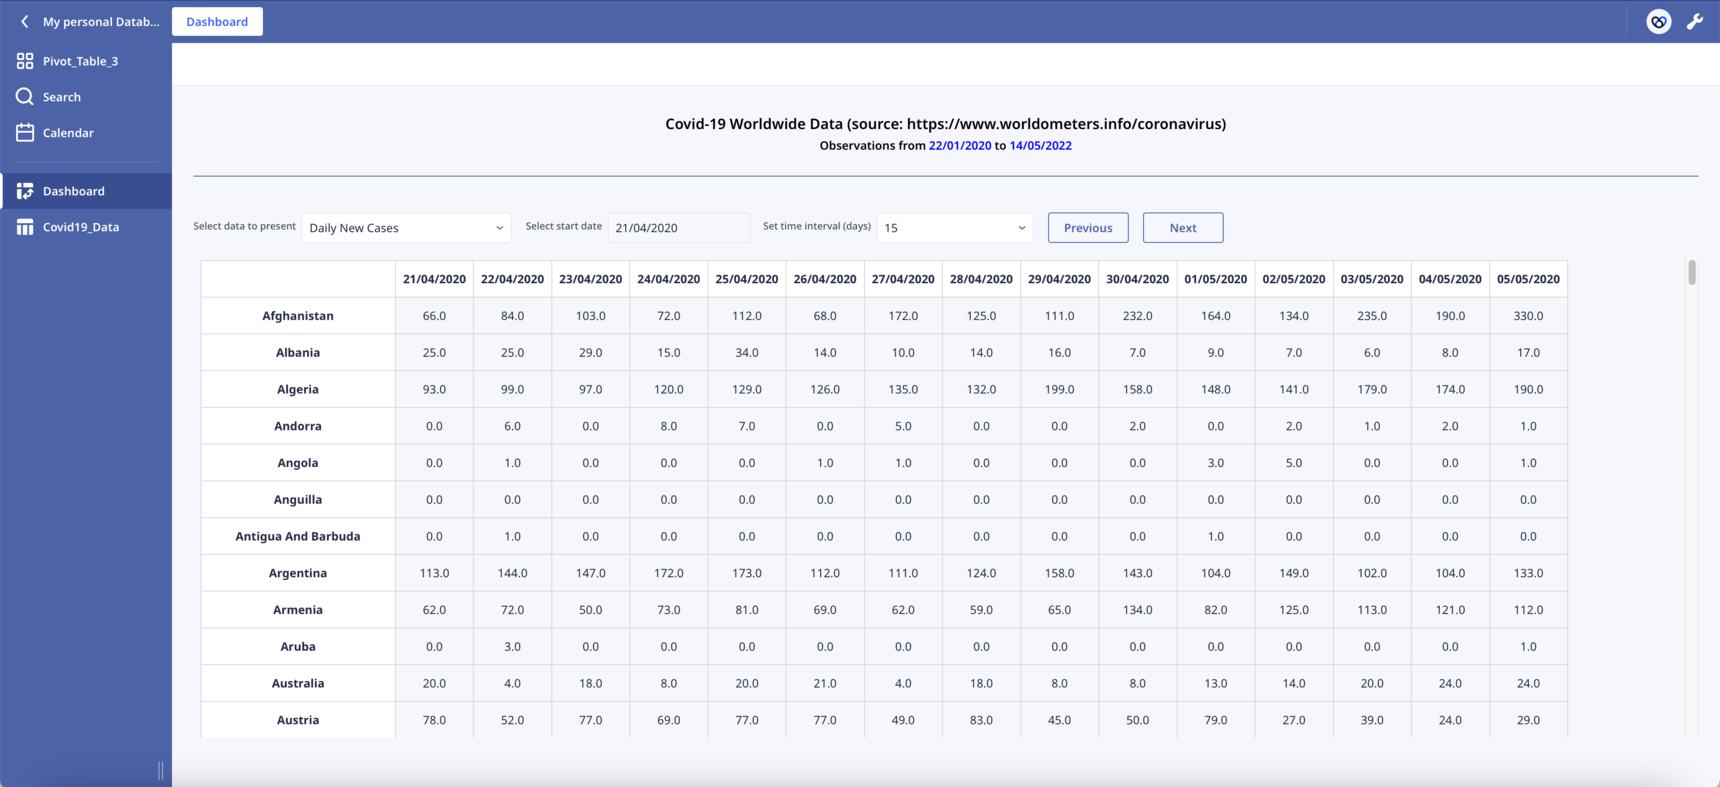
Display extensive datasets via a custom HTML table.
Hello everyone,
Following up on my previous post, I am happy to share the lessons I have learned working with an extended dataset.
Although Ninox offers many ways to present data, a custom HTML table lets you show it exactly how you want.
In my experience so far:
- One form of pagination is possible, i.e., loading only chunks of the data, dramatically reducing waiting times.
- The 'Select' statement in combination with 'where' is quite efficient when used on the server side.
- Create a new JSON object based on initial data to reduce further the amount of information fetched. Build it on the server side.
- 'Nested loops' are heavy computational tasks. They cannot be avoided during pivot to ensure data consistency, especially if missing values are present. If enough memory and computing power are available, running the code on the user side is better.
- The combination of cached() and invalidate() functions works quite well.
The code of the Pivot Table is following:
let startDate := 'Select start date';
let endDate := 'End date';
let values := number('Select data to present');
let data := cached(do as server
            let x := ((select Covid19_Data where date >= startDate and date <= endDate) order by date);
            switch values do
            case 1:
                x.{
                    ID: Id,
                    Date: date,
                    Country: country,
                    Values: daily_new_cases
                }
            case 2:
                x.{
                    ID: Id,
                    Date: date,
                    Country: country,
                    Values: daily_new_deaths
                }
            case 3:
                x.{
                    ID: Id,
                    Date: date,
                    Country: country,
                    Values: active_cases
                }
            case 4:
                x.{
                    ID: Id,
                    Date: date,
                    Country: country,
                    Values: cumulative_total_cases
                }
            case 5:
                x.{
                    ID: Id,
                    Date: date,
                    Country: country,
                    Values: cumulative_total_deaths
                }
            end
        end);
let tdata := "<tr><th></th>" + unique(data.("<th>" + date(Date) + "</th>")) + "</tr>" +
    for loop1 in unique(sort(data.Country)) do
        "<tr>
            <td style='background-color: #ffffff'>" +
        loop1 +
        "</td>" +
        for loop2 in unique(data.Date) do
            let y := last(data[Country = loop1 and Date = loop2]);
            "<td><span onclick=""ui.popupRecord('" + raw(y.ID) +
            "')""; style=""cursor: pointer;"">" +
            y.Values +
            "</span></td>"
        end +
        "</tr>"
    end;
html("<head>
<style>
    .pivot-table {
        border-collapse: collapse;
        width: auto;
        table-layout: auto; /* Column width based on content */
        white-space: nowrap; /* Prevent text wrapping */
    }
    .pivot-table th, .pivot-table td {
        border: 1px solid #dddddd;
        text-align: center;
        padding: 8px;
    }
    .pivot-table th {
        background-color: #ffffff;
        position: sticky;
        top: 0;
        z-index: 2; /* Higher z-index to ensure it's above other elements */
    }
    .pivot-table th:first-child {
        background-color: #ffffff;
        font-weight: bold;
        position: sticky;
        left: 0;
        z-index: 3; /* Higher z-index to ensure it's always on top */
        width: 200px; /* Custom width for the first column */
    }
    .pivot-table td:first-child {
        background-color: #ffffff;
        font-weight: bold;
        position: sticky;
        left: 0;
        z-index: 1; /* Lower z-index to ensure it's below the first column header */
        max-width: 200px; /* Set maximum width for the first column */
        overflow: hidden; /* Hide overflow content */
    }
</style>
</head>
<body>
<div>
<table id='pivotTable' class='pivot-table'>
" +
tdata +
"
</table>
</div>
</body>")
I have included a working example in the attached database, incorporating all of the above.
I hope this is useful to you. 🙂
4 replies
-
Hi Sotirios , you can post the DB with only 100 or 150 records ? I can Upload the DB.
Appreciate
-
Hey :) Cool post... we also discovered that customers need very individual display options for a table. In order to customize the user interface and save clicks in sub-tables, we have developed Ninox Widgets. Here you can, for example, carry out actions directly in the table: checklists, for example, or dropdowns directly in the table column. Feel free to take a look: https://www.arc-rider.de/documentation/custom-table-mit-mini-widgets
Content aside
-
3
Likes
- 1 yr agoLast active
- 4Replies
- 473Views
-
4
Following